About Us

The Quantlogic Edge Speedo represents a significant advancement in the field of US equities visualization and analysis. This next-generation platform transcends the limitations of traditional chart-based analysis, offering a more intuitive and comprehensive view of market dynamics. Here are some of its key features:


Unlike traditional charts, Quantlogic Edge Speedo turns complex market dynamics into clear, easily understandable visuals. This approach allows traders and analysts to quickly grasp the nuances of supply and demand in the US stock market.


The platform integrates multiple time frames, ranging from days to 84 months, into a single, cohesive visual. This unique feature enables users to analyze trends, Points of Control (POCs), Bell Curve Peaks, and Standard Deviations simultaneously, providing a multi-dimensional perspective of the market.


Quantlogic Edge Speedo offers unparalleled clarity and depth, cutting through the clutter of data to present a comprehensive overview of market dynamics at a glance. It surpasses traditional charts in delivering insightful and detailed market analysis.


The platform generates detailed reports, categorizing all S&P 500 symbols by Index, Sector, Industry Group and Industry. This contextualization of data is a first in the global market, offering insights that are otherwise unavailable.

Recognizing the importance of understanding the balance between buyers and sellers, Quantlogic Edge Speedo incorporates this symbiosis into its algorithms, enhancing their potential and accuracy.

The platform excels in distilling complex market data into clear, actionable investment strategies. This simplification aids users in interpreting and utilizing the information effectively.

By providing a nuanced and synthesized view of diverse data sets, Quantlogic Edge Speedo equips users with a strategic advantage in portfolio management and equity research.

The "speedometer-like" interface is an apt metaphor for the platform's efficiency. It reflects the ease with which users can translate complex market dynamics into actionable insights.

Quantlogic Edge: A Revolution in Visualizing Multi-Dimensional Market Patterns**

The vast universe of financial markets is a complex web of ever-evolving patterns. These patterns, spanning across multiple time frames, can be the key to unlocking unparalleled insights, yet they remain elusive to many analysts relying on traditional tools. Nicholas Scarr, with his team, recognized this challenge early on during their extensive research under the Amadeus project.

It became evident that the market's dynamic nature, much like a chameleon, required a more robust and nuanced approach to decode its subtleties. The linear and static nature of traditional charts often fell short in capturing the multi-faceted dimensions of these market patterns.

Enter Quantlogic Edge.

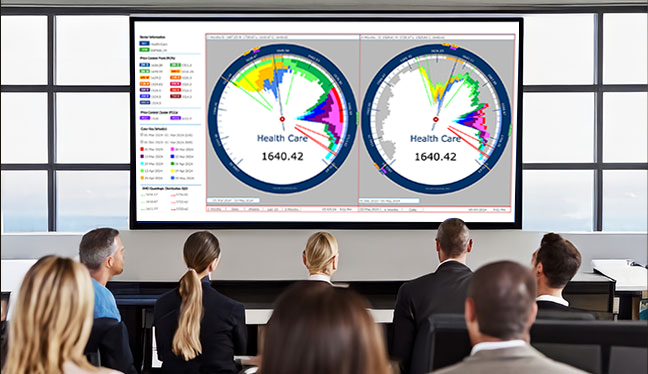
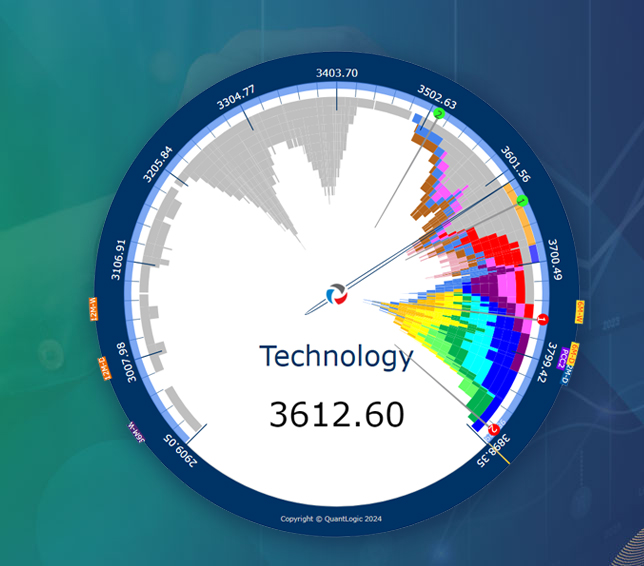
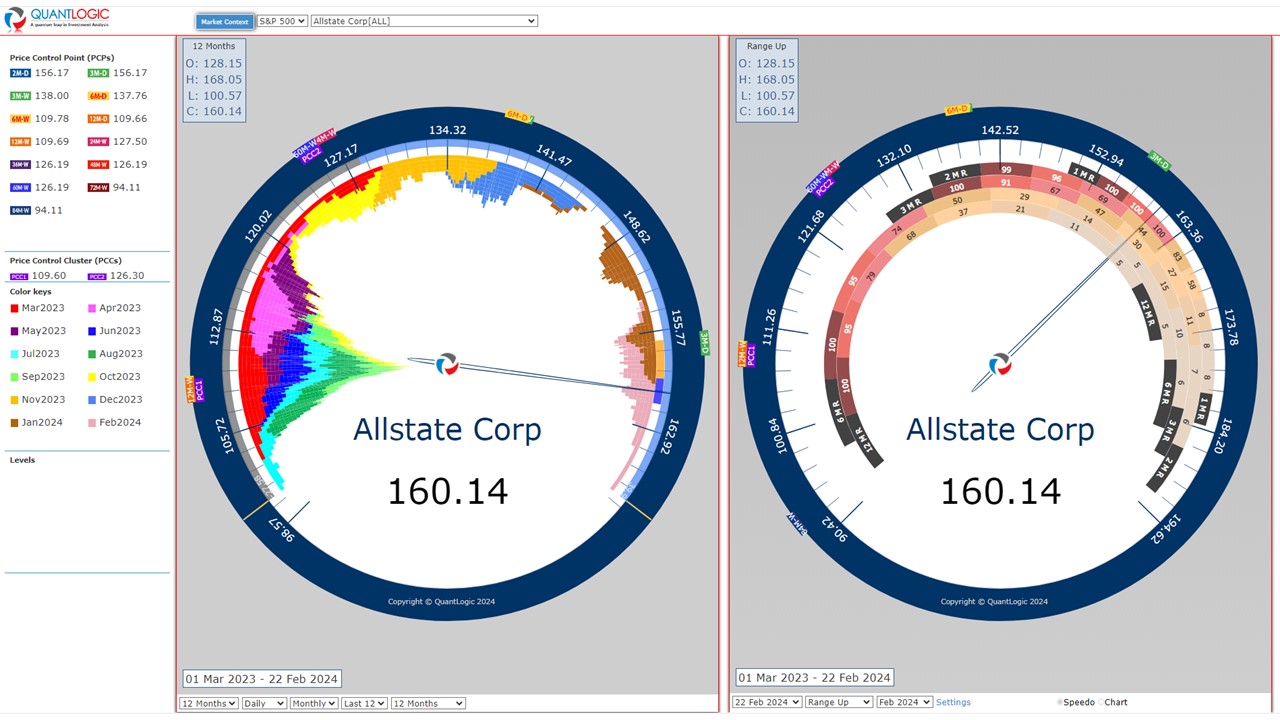
What sets Quantlogic Edge apart is its pioneering approach to visualizing these patterns. By analyzing data through multiple time frames and then representing it within the prism of a speedometer-like interface, Quantlogic Edge provides a vivid, real-time snapshot of the market's pulse. This innovative design cuts through the noise, offering clarity that was previously unattainable.

No longer are investors and traders restricted by the two-dimensional limitations of charts. With Quantlogic Edge, they can now see the market's shifting sands in a clear, concise, and comprehensible manner. This holistic view empowers users to anticipate market moves with greater confidence, ensuring they're always one step ahead.

In essence, Quantlogic Edge is not just a platform; it's a paradigm shift in market visualization. By bringing the intricate dance of market patterns into sharp focus, it is redefining the way we understand and engage with the financial landscape.

What our clients say

"The depth and breadth of Quantlogic's research database is staggering, and their team of quants and technical analysts, second to none. I find their daily support and resistance levels to be incredibly accurate and useful for calculating the strike levels of our Dual Currency Instrument products. "

Senior Insights Trading Manager, HSBC (Hong Kong)
What our clients say

"Quantlogic's research capability is first class. Their results speak for themselves and I have seen firsthand how their exhaustive research produces better and better strategies. For that reason, I am delighted to recommend them to anyone who is serious about their trading."

Fund Manager, Funds for Growth
What our clients say

"I have no hesitation in strongly recommending the impressive team of Quantlogic. Having spent four fascinating days looking at their organisation, I came away enormously inspired and motivated and in no doubt they could do a great deal not only for ANZ but for Fund Houses and investors around the World."

FX Strategy and Technical Analysis Director, ANZ Banking Group (Singapore)
3 / 4

Why Fund Managers Focused on Fundamentals Should Explore Quantlogic

Fundamental analysis, at its core, revolves around the examination of financial statements, industry trends, and broader economic factors to determine the intrinsic value of a security. While it provides a solid foundation, the financial markets behavior isn't governed by fundamentals alone. There's a layer of market psychology, driven by the interactions of buyers and sellers, that can significantly impact the price movements in the short to medium term.

In essence, while fundamental analysis provides a strong backbone for investment decisions, Quantlogic brings in the finesse of understanding the market's pulse. In a competitive landscape, the blend of both can offer a distinctive edge, ensuring that fund managers are equipped with a 360-degree view of the market, poised to capitalize on every opportunity.

Case Study

Conduct market research to understand industry competition.

Explore Case Study

Explore the future of financial analysis with Quantlogic. Book a session to see our cutting-edge tools in action.

Schedule a meeting